Hurricanes Getting Stronger, Or Are They?

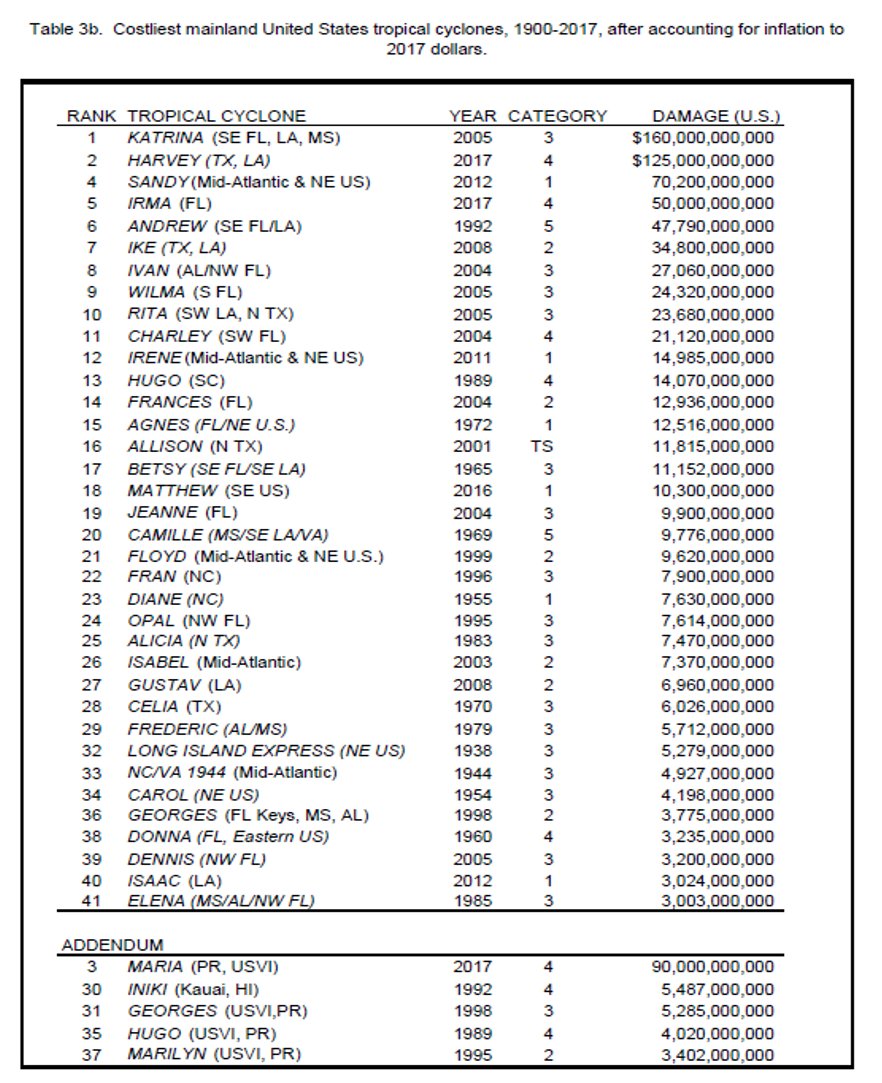
The in collaboration with NHC has updated the listing of the costliest tropical cyclones to strike the U.S. with a new methodology through the 2017 season. For more details see: &

At first glance, it certainly appears that hurricanes are getting more destructive and costly in recent years. However, things are not always as they seem. Let’s look at it.

50 years ago, a hurricane making landfall had a pretty good shot at coming ashore on pretty undeveloped land. As the years have progressed, explosive development has occurred on our shorelines, and cities near the coasts have also blossomed and grown into huge metropolises. Therefore, the same hurricane, hitting the same desolate coastline 50 years ago, may very well be hitting a densely populated area today. It stands to reason that damage would be much higher today, and more costly with inflation.

Additionally, many poor decisions have been made by planners. Large areas of Houston which were always meant to flood in heavy rain were opened up to development. Not all of Houston flooded during this summer’s Harvey, but those developed flood areas sure did. The same goes for New Orleans. It is below sea level, and the dysfunctional government in that city did not take care of the infrastructure. The Weather Channel broadcast a what-if scenario several years before Katrina which pretty well simulated what happened.

None of this is to say that hurricanes absolutely are not getting stronger. They may be. They may not be. It is complicated. The only thing for sure is that those who claim it is settled science cannot be trusted.

Don’t Believe The Winter Storm Hype

Bryan Wood, a meteorologist/Storm Damage Analyst at Assurant, posted a series of tweets today regarding the hype surrounding last week’s winter storm. These are some very astute insights and worthy of your time to consider. Bryan’s Twitter feed can be found at @bryanwx.

The only point I might differ with is the ice. Last Friday’s storm was not destined to be a big ice producer on pavement because it was preceded by 2 days of near record warmth and pavement temperatures were too warm to support glaze from freezing rain. Water from heavy rain and runoff did later produce some black ice.

Here are Bryan’s observations from his “Tweet storm”:

  • Some thoughts & reflections on Friday’s & today’s snow events here regionally, but can be applicable anywhere. People will interpret any image you post on social media how they want. Don’t assume that by linking it to a video that they’ll watch it.
  • This week, an image showing two model outputs with either 2″ of snow or 23.1″ of snow. Snow lovers clung to that 23.1 inches of snow, despite historical odds being low…and this storm was clearly not going to be historical by any means. No context given, other than “watch us”.
  • This happened in Columbus, but spilled over into other markets like Cincinnati & Dayton because they also had “high amounts”. This caused a lot of questions & work for other meteorologists. We have employees in Columbus – I had over 40 people ask about this specific image.
  • The vast majority of them only saw the big numbers, did not watch the TV station or their videos. The only context they saw was 23.1 inches. They assumed it was a forecast because they don’t understand the nuances of predictive models.
  • Needless to say, they were almost unanimously upset. “they just want people to watch”, “hype merchants” were some of the phrases used. They watch you because you’re an expert. They want YOUR forecast. Most of these people I talked to said they won’t watch this station anymore.
  • The thing that was most upsetting to me is that I’ve always recommended this channel to friends, coworkers and even clients in Columbus. The exact reason why is that they don’t (didn’t?) try baiting tactics like this and just gave it straight to the viewer. I admired that.
  • While snow totals are important to communicate, I think we can overemphasize it in an overall context of a winter storm & its impacts. This storm had ice potential (thankfully not as bad as it could’ve been) and the timing of snow was big – evening rush hour.
  • I saw a ton of images about snow totals “through Saturday”. I saw very little images about the onset of snow, at which point, serious road issues would begin. This is a critical point to help people make decisions to stay in or venture out. Are we giving them the info they need?
  • Related to ice: We (wx community) forecasted up to 0.1″ of ice. Feedback I recieved: Many people interpreted this as “not bad”. When we get 0.1″ of rain, it’s not a big deal. In ice, it can crush travel. Is there a better way to communicate how dangerous 0.1″ of ice can be?
  • Summary: Don’t just study how your physical forecast compared to reality. Listen to your feedback. Don’t take it personally. Think about what people are saying. If they’re upset with you over “hype” (real or perceived) – you didn’t communicate & inform the way they needed.
  • I (professionally) took it on the chin from some higher ups last month for a winter forecast in Atlanta. It was deserved. I didn’t take it personally. I thought about how I could better inform both impacts & confidence. Be open, be thoughtful, Improve.
  • Oh, and if you rip all the NWS offices in/around your TV market for “being too low” with snow total forecasts and go way too high with your forecast, the storm didn’t underachieve, your forecast did.

Note: The Arbor Doctor Weather Blog will always strive to provide sound information, not hype, and sort through it all for you!


The Insulating Qualities of A Snowy Winter Blanket

Every spring, Yardboy Ron Wilson shares a soil temperature map in his blog and talks about it on his radio show. This map is useful for seeing how soil temperatures are warming and when they are suitable for planting.Image may contain: tree, sky, snow, plant, outdoor and nature

I took a look at that map this morning, which can be seen here, and something interesting popped out at me. Soil temperatures are very cold over much of the country, approaching zero degrees Fahrenheit in parts of the midwest. A closer look at the map shows something interesting.

Soil temperatures in the lee of the Great Lakes, near Cleveland, OH, Erie, PA, Buffalo, NY, and Watertown, NY, for example, are quite warm, near freezing and similar to soil temperatures in the south. Why would temperatures in these very cold and snowy locations be so mild? The answer is in the snow.

Many people cry and wail in winter when it snows. Certainly some people in Erie, PA, were crying over the 5 feet of snow they got Christmas week. However, from the perspective of our plants, that snow is a very good thing. Yes, it can get heavy, but it also is a wonderful insulator. https://maxpull-tlu7l6lqiu.stackpathdns.com/wp-content/uploads/2004/10/new_york_map_lg.gifPlants under all that snow are protected from the bitter cold, and their root systems in particular are protected. When all that snow melts, soil moisture will be replenished. Observe how the New York State plant hardiness zones, in the map to the right, in the areas adjacent to lakes Erie and Ontario, are as warm as near New York City, and much warmer than nearby interior areas.

So, what about areas that don’t have all that snow? In those areas, plants are fully exposed to the elements and bitter cold. Soil temperatures plunge and root systems chill as well. Sensitive plants may be damaged or even killed in such harsh conditions. Plant hardiness zones are actually colder in areas further south which get inconsistent snow and frequent cold.

So, the next time heavy snow falls, try to remember that your plants benefit greatly from it. It sure is beautiful, too!