Hurricane Iota Discussion Number 12
NWS National Hurricane Center Miami FL AL312020
400 AM EST Mon Nov 16 2020
Iota has explosively deepened 26 mb during the past 6 hours and has
rapidly intensified an incredible 35 kt during that same time. An
Air Force Reserve reconnaissance aircraft and aircrew that flew the
arduous, 10-hour round-trip mission into Iota reported a maximum
700-mb flight-level wind speed of 134 kt and peak SFMR surface winds
of 121 kt, which supports the initial intensity of 125 kt, making
Iota a strong Category 4 hurricane. Furthermore, the pressure fell
an amazing 10 mb from 945 mb down to 935 mb in a little over an hour
between those two fixes. The crew also encountered intense lightning
and hail in the southwestern quadrant, where recent remote data
indicate that frequent lightning is still occurring. The aircrew
reported that the eye was around 15 n mi wide, and the latest
GOES-16 hi-resolution infrared satellite imagery confirms that the
eye diameter, and that the eye has cleared out with continued
warming eye temperatures and cooling surrounding cloud tops.
Iota is moving north of due west, or 280/09 kt. A westward to
west-northwestward motion is forecast until powerful Hurricane Iota
makes landfall in northeastern Nicaragua later tonight. Shortly
after landfall, a building ridge to the north of the hurricane is
expected to nudge Iota on a more westward track through 36 hours,
followed by a slower west-southwestward motion across central and
southwestern Honduras until it dissipates in the 72-96 hour
period. The latest model guidance remains tightly clustered. The
new NHC track forecast is very similar to the previous advisory
track, and lies close to a blend of the consensus track models TVCN,
NOAA-HCCA, and FSSE.
Iota is expected to remain in environmental conditions characterized
by near-zero vertical wind shear, SSTs near 29 deg C, and a moist
mid-level environment. The combination of these factors plus the
relatively small radius of maximum winds (RMW) of about 10 n mi,
argues for continued rapid strengthening right up until landfall
occurs, and Iota could be near Category 5 strength at that time.
After landfall, rapid weakening is expected over the rugged terrain
of Nicaragua and Honduras. Iota is forecast to become a tropical
storm by 36 hours, and degenerate into a post-tropical remnant low
by 60 hours, if not sooner, which is in line with the SHIPS
intensity inland decay model. The NHC official intensity forecast
remains above of all of the available guidance through 24 hours, and
then closely follows the Decay-SHIPS intensity model thereafter.
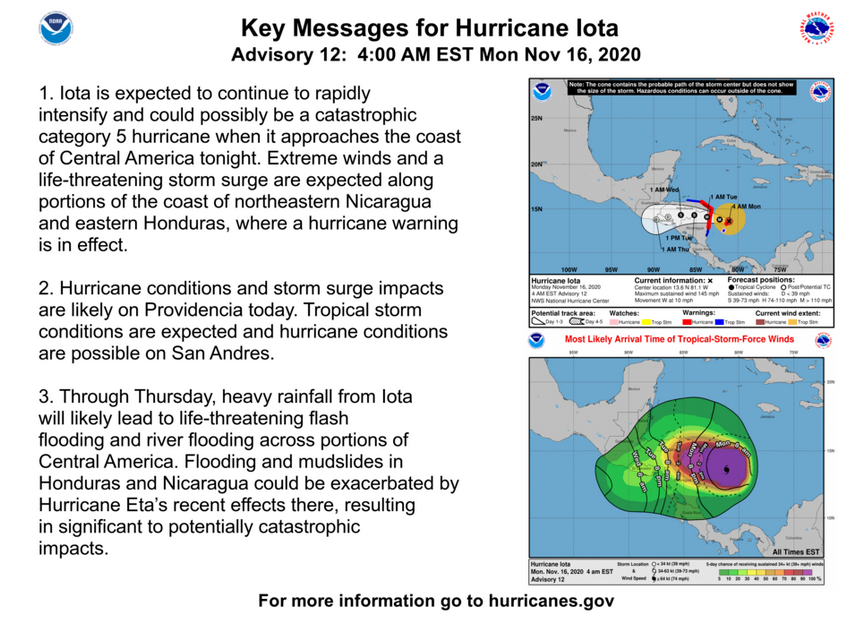
Key Messages:
1. Iota is expected to continue to rapidly intensify and could
possibly be a catastrophic category 5 hurricane when it approaches
the coast of Central America tonight. Extreme winds and a
life-threatening storm surge are expected along portions of the
coast of northeastern Nicaragua and eastern Honduras, where a
hurricane warning is in effect.
2. Hurricane conditions and storm surge impacts are likely on
Providencia today. Tropical storm conditions are expected and
hurricane conditions are possible on San Andres.
3. Through Thursday, heavy rainfall from Iota will likely lead to
life-threatening flash flooding and river flooding across portions
of Central America. Flooding and mudslides in Honduras and Nicaragua
could be exacerbated by Hurricane Etas recent effects there,
resulting in significant to potentially catastrophic impacts.
FORECAST POSITIONS AND MAX WINDS
INIT 16/0900Z 13.6N 81.1W 125 KT 145 MPH
12H 16/1800Z 13.8N 82.2W 135 KT 155 MPH
24H 17/0600Z 14.1N 83.7W 120 KT 140 MPH…INLAND
36H 17/1800Z 14.3N 85.2W 55 KT 65 MPH…INLAND
48H 18/0600Z 14.3N 86.8W 35 KT 40 MPH…INLAND
60H 18/1800Z 14.1N 88.3W 20 KT 25 MPH…POST-TROP/INLAND
72H 19/0600Z 13.8N 89.7W 20 KT 25 MPH…POST-TROP/INLAND
96H 20/0600Z…DISSIPATED


 –
–

 >>>
>>>


