Summer 2022 and the Ring of Fire

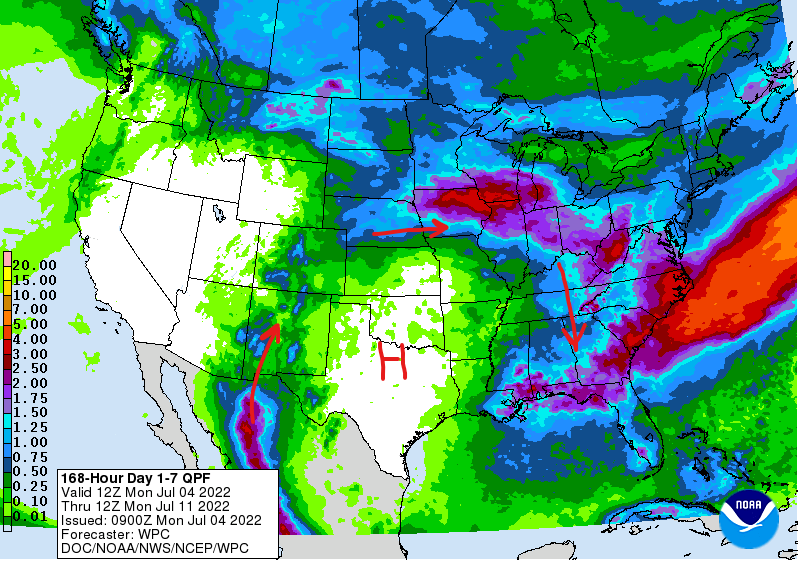
The 2022 “Ring Of Fire” pattern can clearly be seen in this recent precipitation outlook map.

Recently a colleague asked me why Cincinnati has gotten such wild storms this spring and summer.  Like many arborists, he has been slammed with tree storm damage calls and was wondering if this is global warming induced.

The global warming question is always a tough one since it involves long term climate trends. What I was able to share with him was that there is really nothing particularly odd about the weather pattern this year.

Every season, and every year, is different. Weather patterns are governed by infinitely complex influences including ocean temperature fluxuations and jet stream anomalies. What happens in the middle east and Pacific Ocean can and often does ultimately affect the weather in North America.

This year, a strong high pressure ridge developed over Texas and has remained in place for much of the summer thus far. Low pressure troughs to its west and east have actually fed this high pressure ridge which produces hot, dry air at its core.

Around the periphery of this high pressure ridge moisture is fed up and over the ridge. This effect is nothing new and is often referred to by meteorologists as the “Ring Of Fire” since thunderstorm complexes develop in this moisture transport. As thunderstorm complexes top the ridge and begin moving southeastward into the extremely hot, humid environments, they sometimes grow into long loved thunderstorm complexes called Mesoscale Convective Systems,  defined as “a complex of thunderstorms which becomes organized on a scale larger than the individual thunderstorms, and normally persists for several hours or more. MCSs may be round or linear in shape, and include systems such as tropical cyclones, squall lines, and Mesoscale Convective Complexes (MCCs) (among others). ”

When thunderstorms intensify and rapidly cool the air in a very hot, humid environment, these MCS thunderstorms can sometimes develop into long lived derechos. A derecho is defined as “a widespread and usually fast-moving windstorm associated with convection. Derechos include any family of downburst clusters produced by an extratropical MCS, and can produce damaging straight-line winds over areas hundreds of miles long and more than 100 miles across.” One of the most intense derechos in recent memory produced major devestation in Iowa on August 10, 2020.

While not technically a hurricane, derechos have been referred to as “inland hurricanes” as is clearly demonstrated by this video of the August 10, 2020, derecho in Cedar Rapids, Iowa, which was exceptionally powerful with peak wind gusts estimated by the National Weather Service of 110-140 mph.

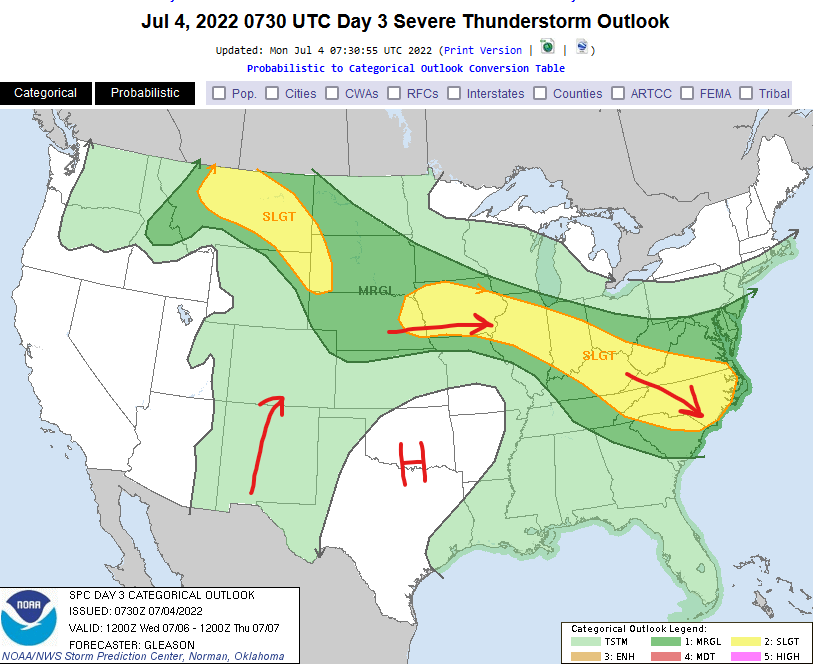
As we move through July, this “Ring Of Fire” pattern is forecast to continue. In fact, the July 4 severe weather outlook clearly shows the potential for severe thunderstorm complexes riding down the northeast side of the “Ring Of Fire”.
For more in depth information on Mesoscale Convective Systems:

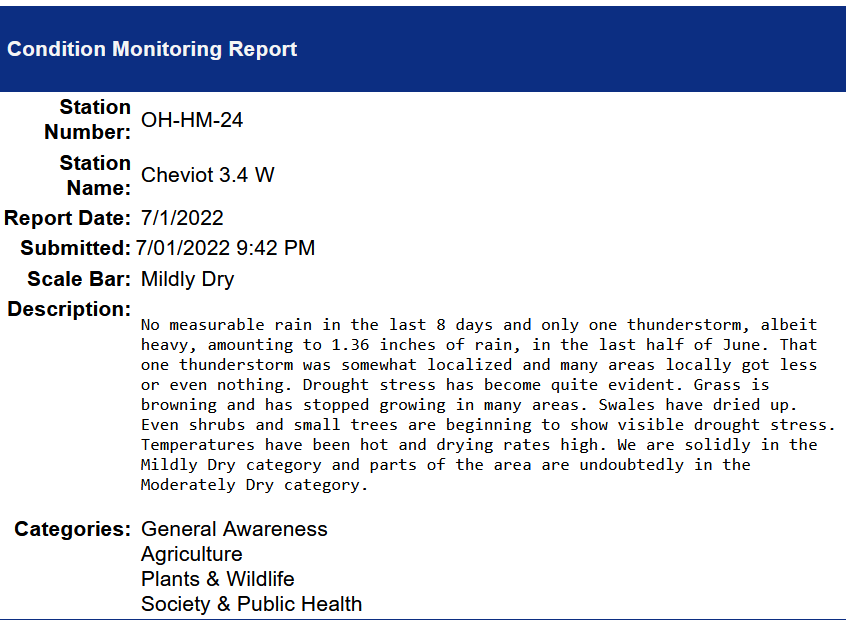
 

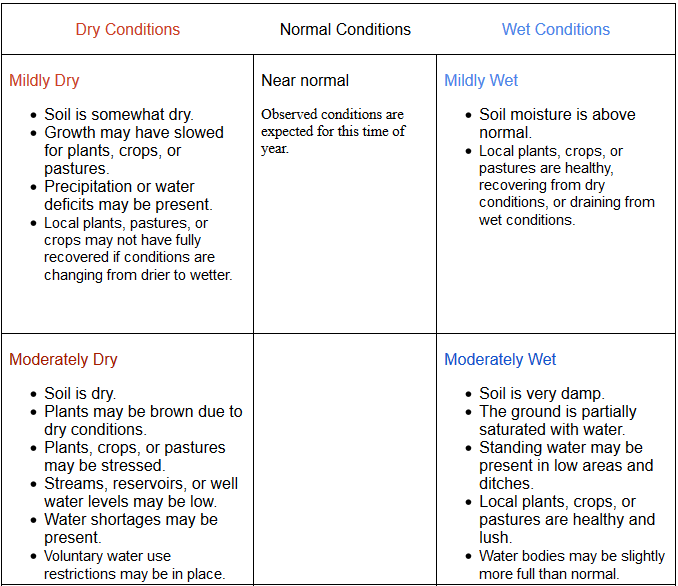
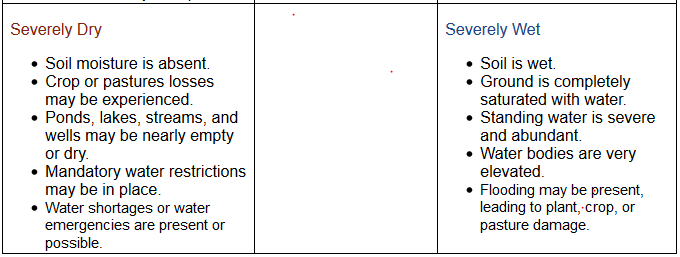
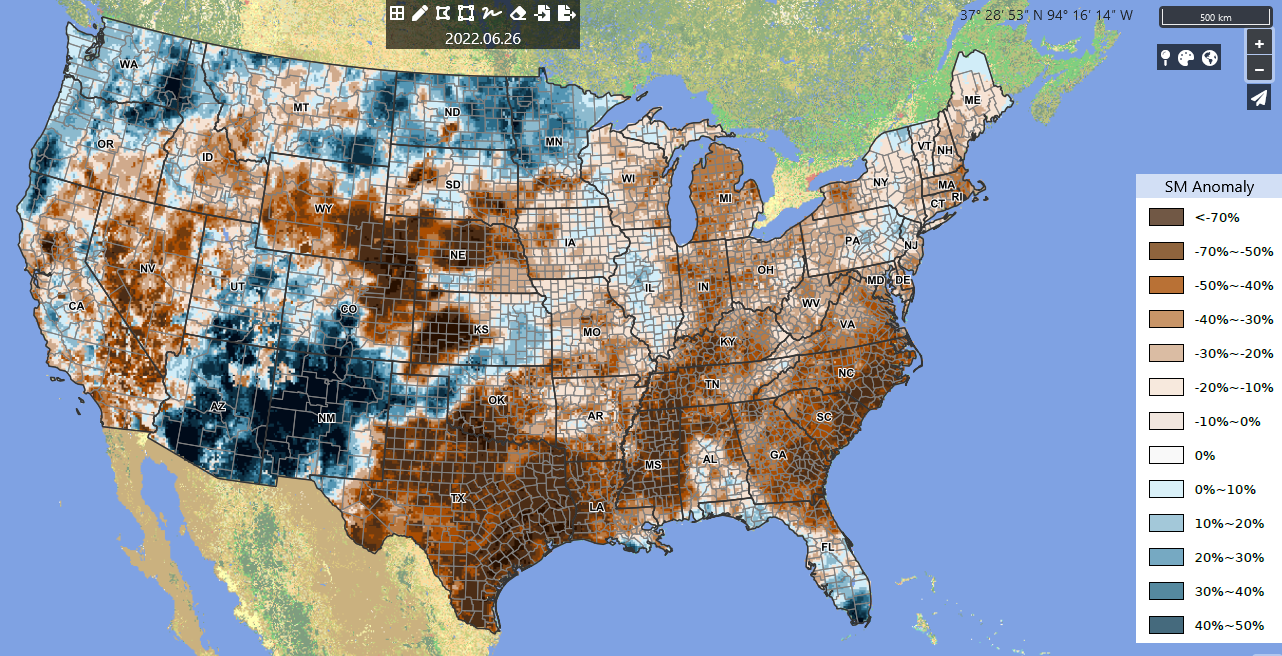
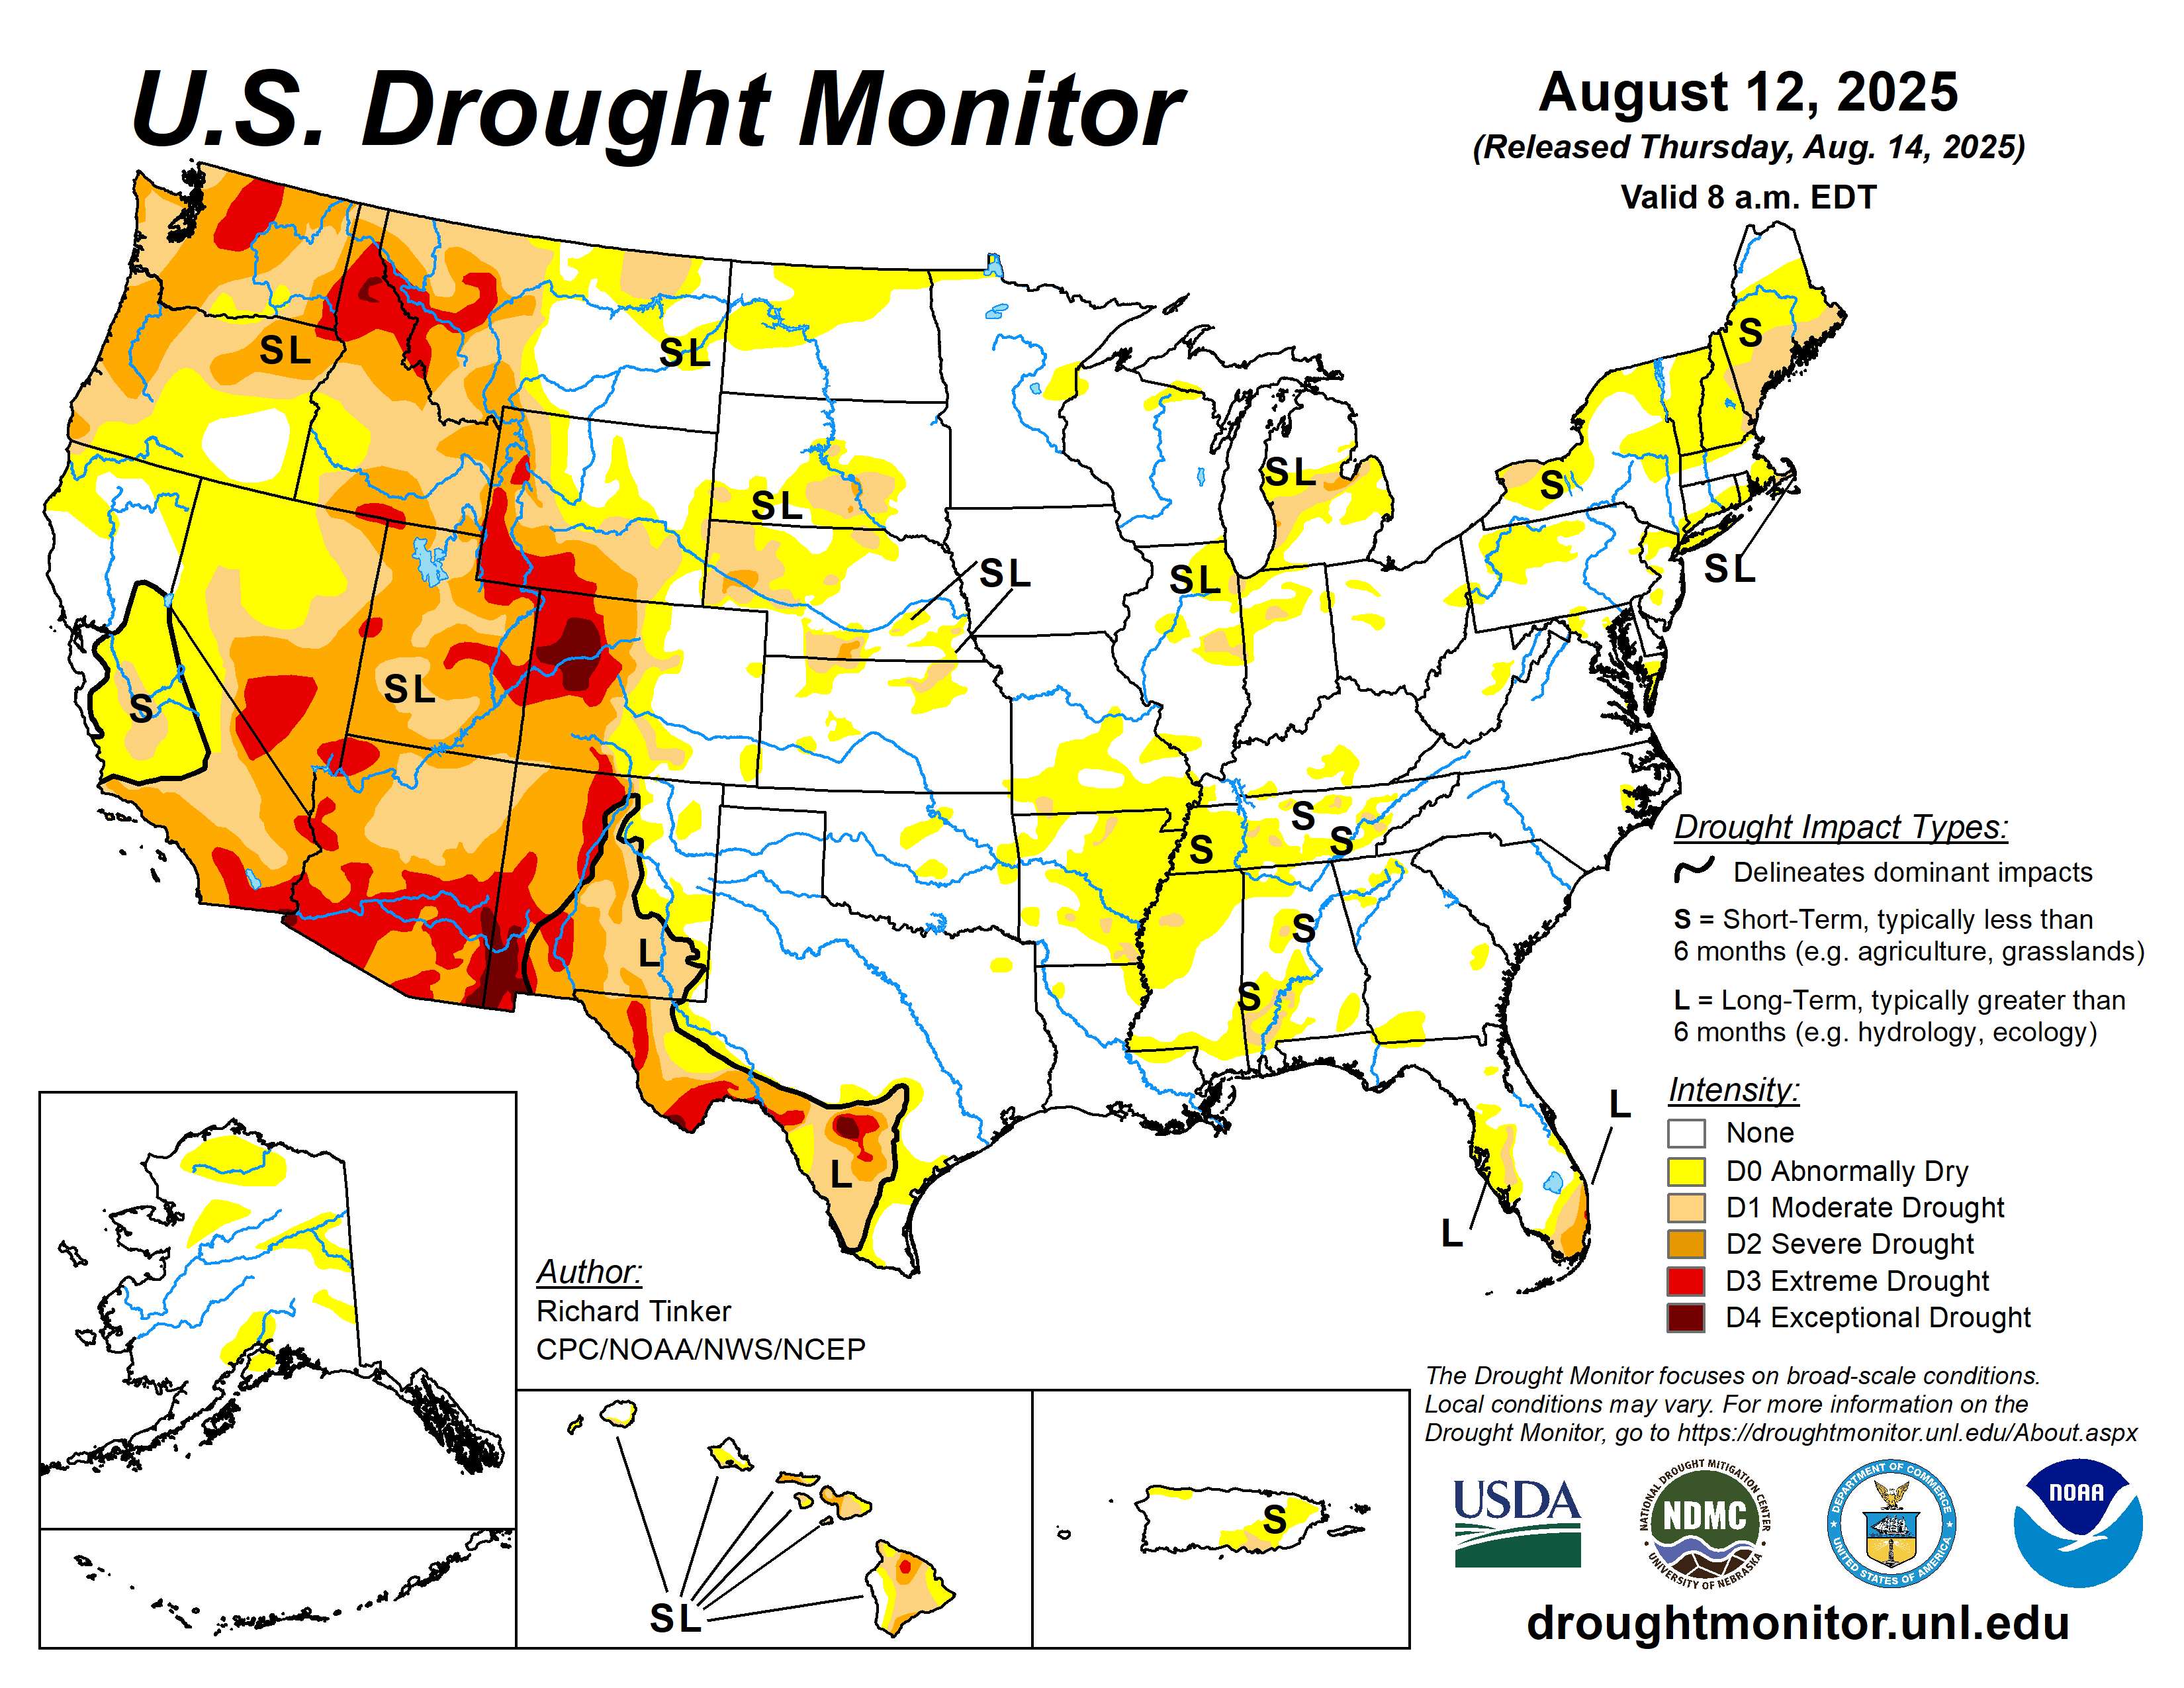
July 1, 2022 Soil Moisture, Drought, and Condition Monitoring Report. Mildly Dry conditions at Cheviot OH 3W. Dry and drought conditions expanding over much of the southeast US up into Kentucky, Indiana, and Illinois. Widespread drought in the southwest US.

.

This report is specifically for the Arbor Doctor’s location 3.4 miles west of Cheviot, OH, in the western suburbs of Cincinnati in southwest Ohio. This location is also an official cooperative observation site for the National Weather Service listed as Cheviot 3W.

What is the Condition Monitoring Report? See these links for more information:

Explanation of scale bar>>>

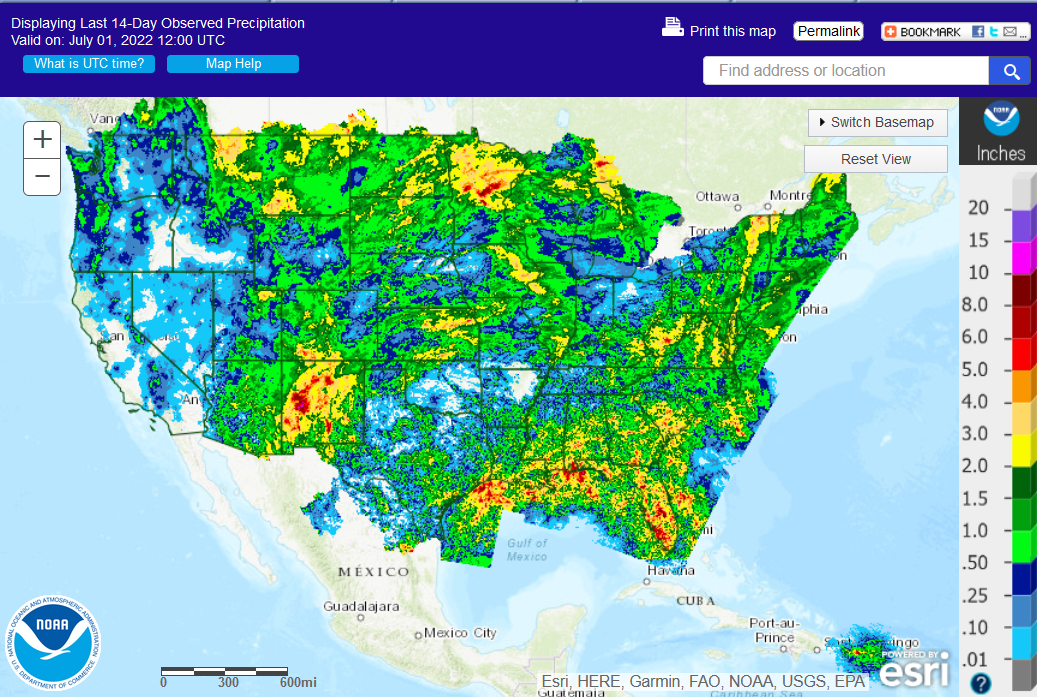
Last 14 Day Precipitation:


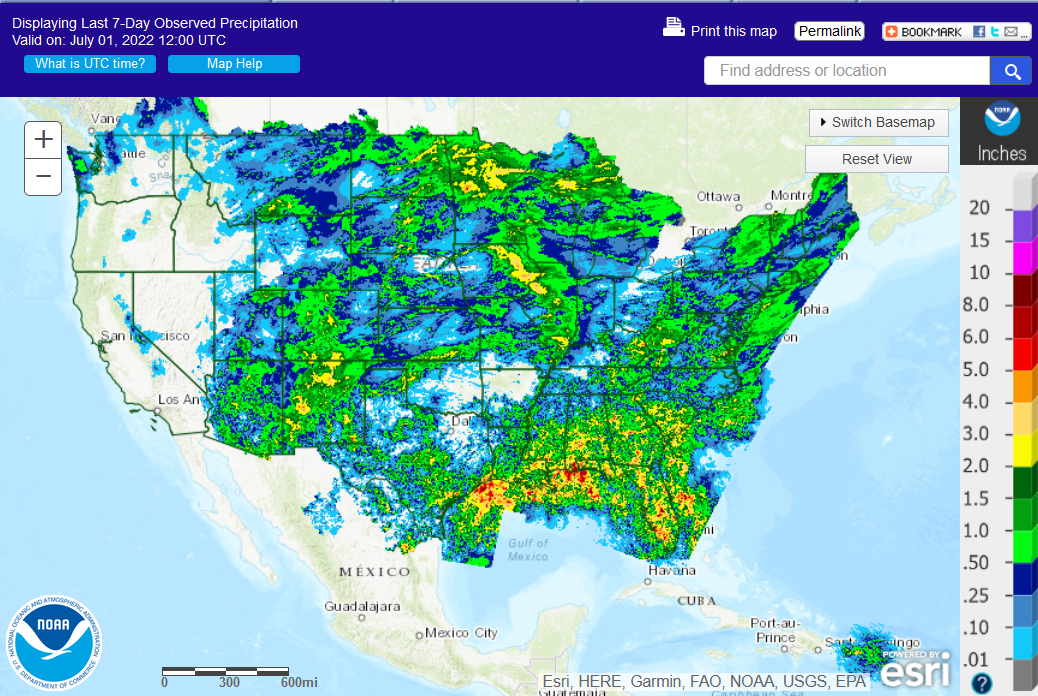
7 day rainfall:

.

.

Search condition monitoring reports for the entire US>>>  

Interactive

Condition Monitoring

Static

Watershed Maps


United States Weekly Drought Monitor

Click on the title or the graphic (above) to access the
U.S. Weekly Drought MonitorPDF Version of Graphic Adobe PDF Reader

United States Monthly Drought Outlook

Click on the title or the graphic (above) to access the
U.S. Monthly Drought OutlookPDF Version of Graphic Adobe PDF Reader

United States Seasonal Drought Outlook

Click on the title or the graphic (above) to access the
U.S. Seasonal Drought OutlookPDF Version of Graphic

Adobe PDF Reader

Other Drought links:


Please remember to water…correctly!

Water once per week, one inch per week, under the entire branch spread, in the absence of rain, May through November. Either rainfall or your watering should equal the one inch per week. Do not water if the soil is already moist. Put out a sprinkler and a straight sided soup can or rain gauge and measure one inch per week. Measure the rainfall which falls in your yard. Your trees don’t care what fell at the airport!

If burlap was left on new trees, it will repel water and the tree or shrub may die. Be sure burlap and twine are removed from the top of all root balls. If your landscaper disagrees, refer him or her to the American National Standards Institute (ANSI) industry standard for installation of landscape plants.

To the extent possible recycle fallen leaves back into the soil around the trees and maintain mulch around the trees to a radius of at least 3-5 feet. Keep mulch off trunks. Use a coarse textured mulch. Avoid triple shredded mulch. Aged arborist wood chips, mulched and composted leaves, pine bark, and pine straw are all good. Very finely ground mulches such as triple ground hardwood mulch are not beneficial and may inhibit moisture and oxygen exchange.

Drought: How Dry Seasons Affect Woody Plants                                                                                                                     >>>


1-inch capacity rain gauge  >>>

Taylor rain gauge   >>>

Watering: How and when>>>

Watering Trees and Shrubs>>>


Meteorological Versus Astronomical Seasons

Spring: March 1-May 31; Summer: June 1-August 31; Fall: September 1-November 30; Winter: December 1-February 28 (29)


You may have noticed that Arbor Doctor, meteorologists and climatologists define seasons differently from “regular” or astronomical spring, summer, fall, and winter. So, why do  meteorological and astronomical seasons begin and end at different times? Climatologically, the period July 14-21, the mid-point of meteorological summer, is the hottest week of the year and the period January 14-21, the mid-point of meteorological winter, is the coldest week of the year over much of the continental US including the Ohio valley.

Read more here>>>