
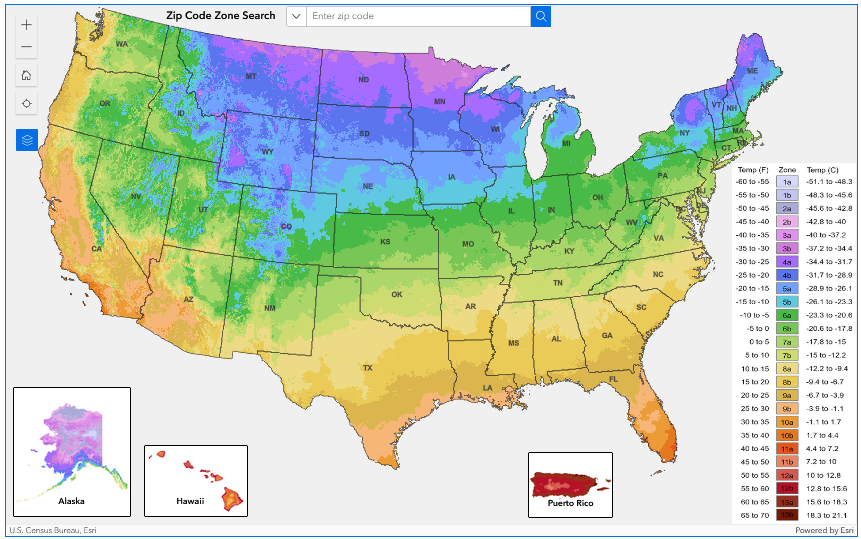
Click here or on the image above for the interactive plant hardiness map>>>
Researchers combined large sets of real-world solar data and advanced machine learning to study the impacts of severe weather on U.S. solar farms, and sort out what factors affect energy generation.