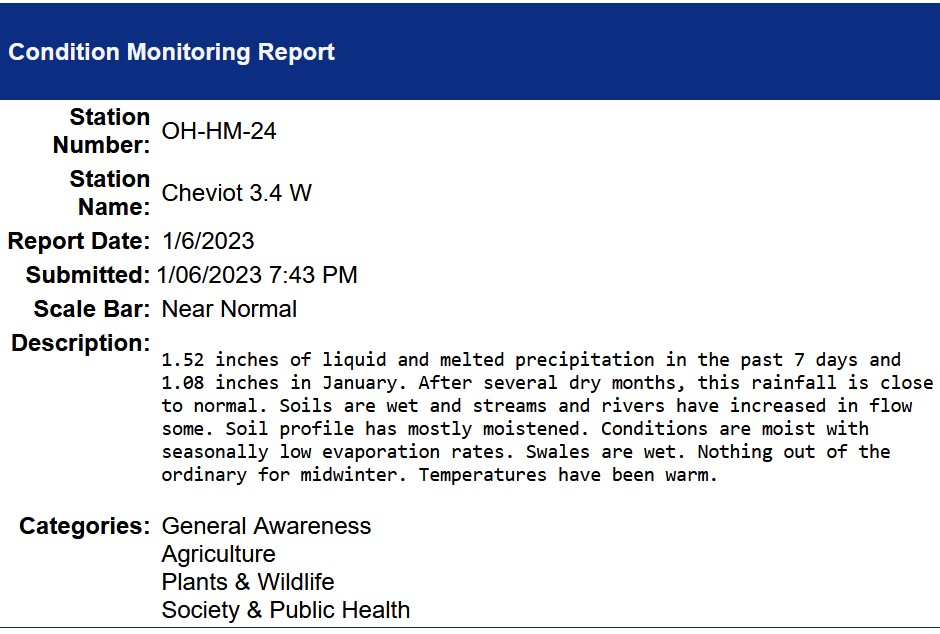
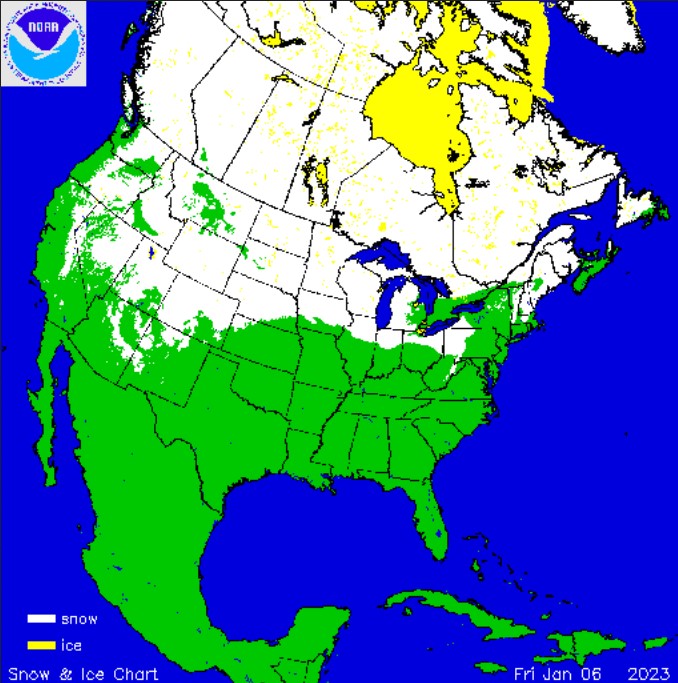
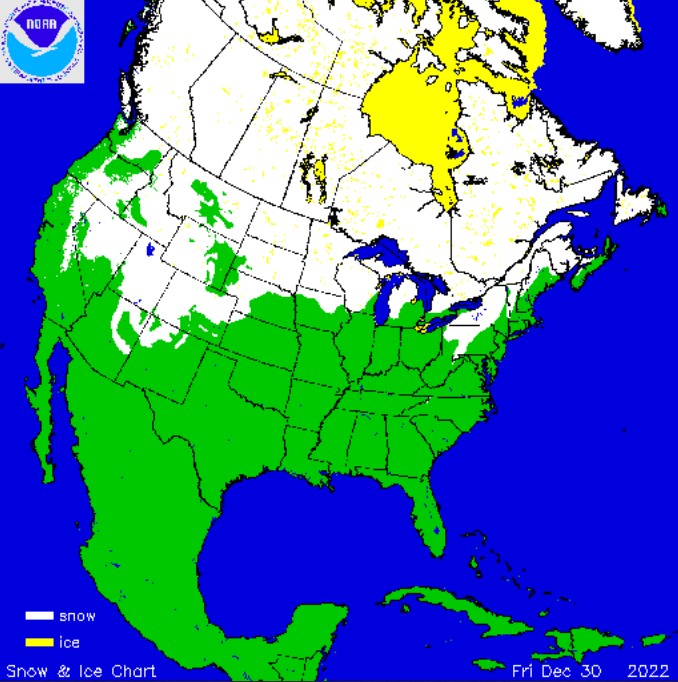
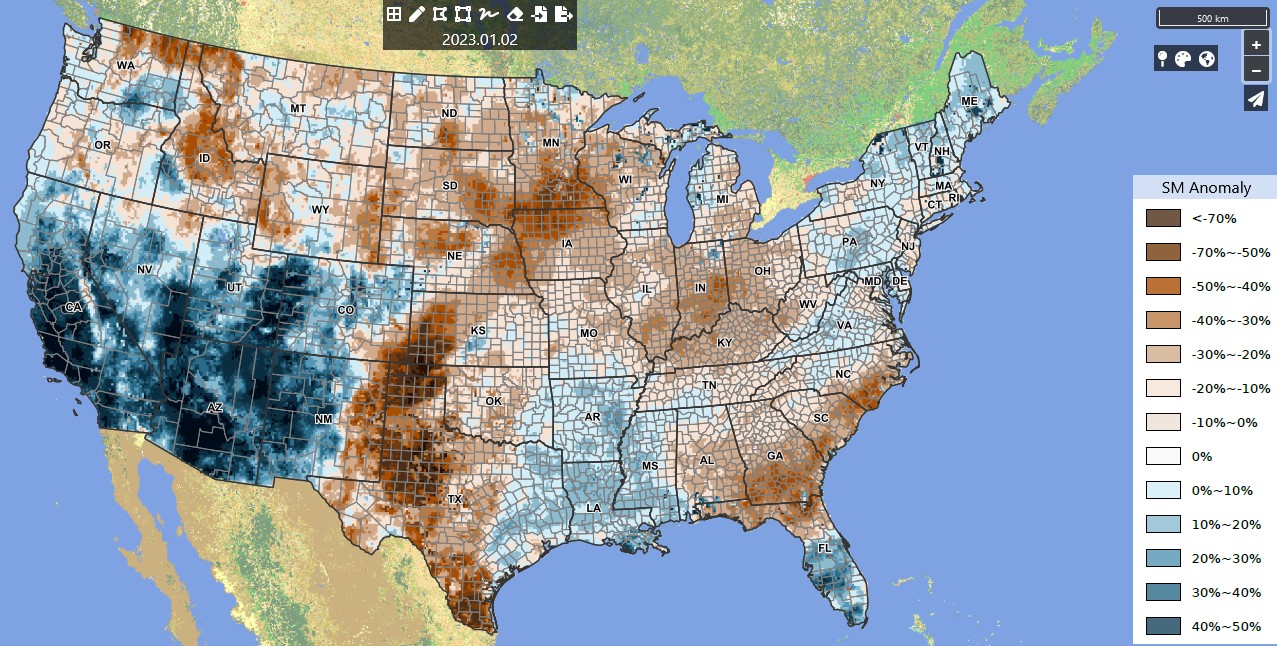
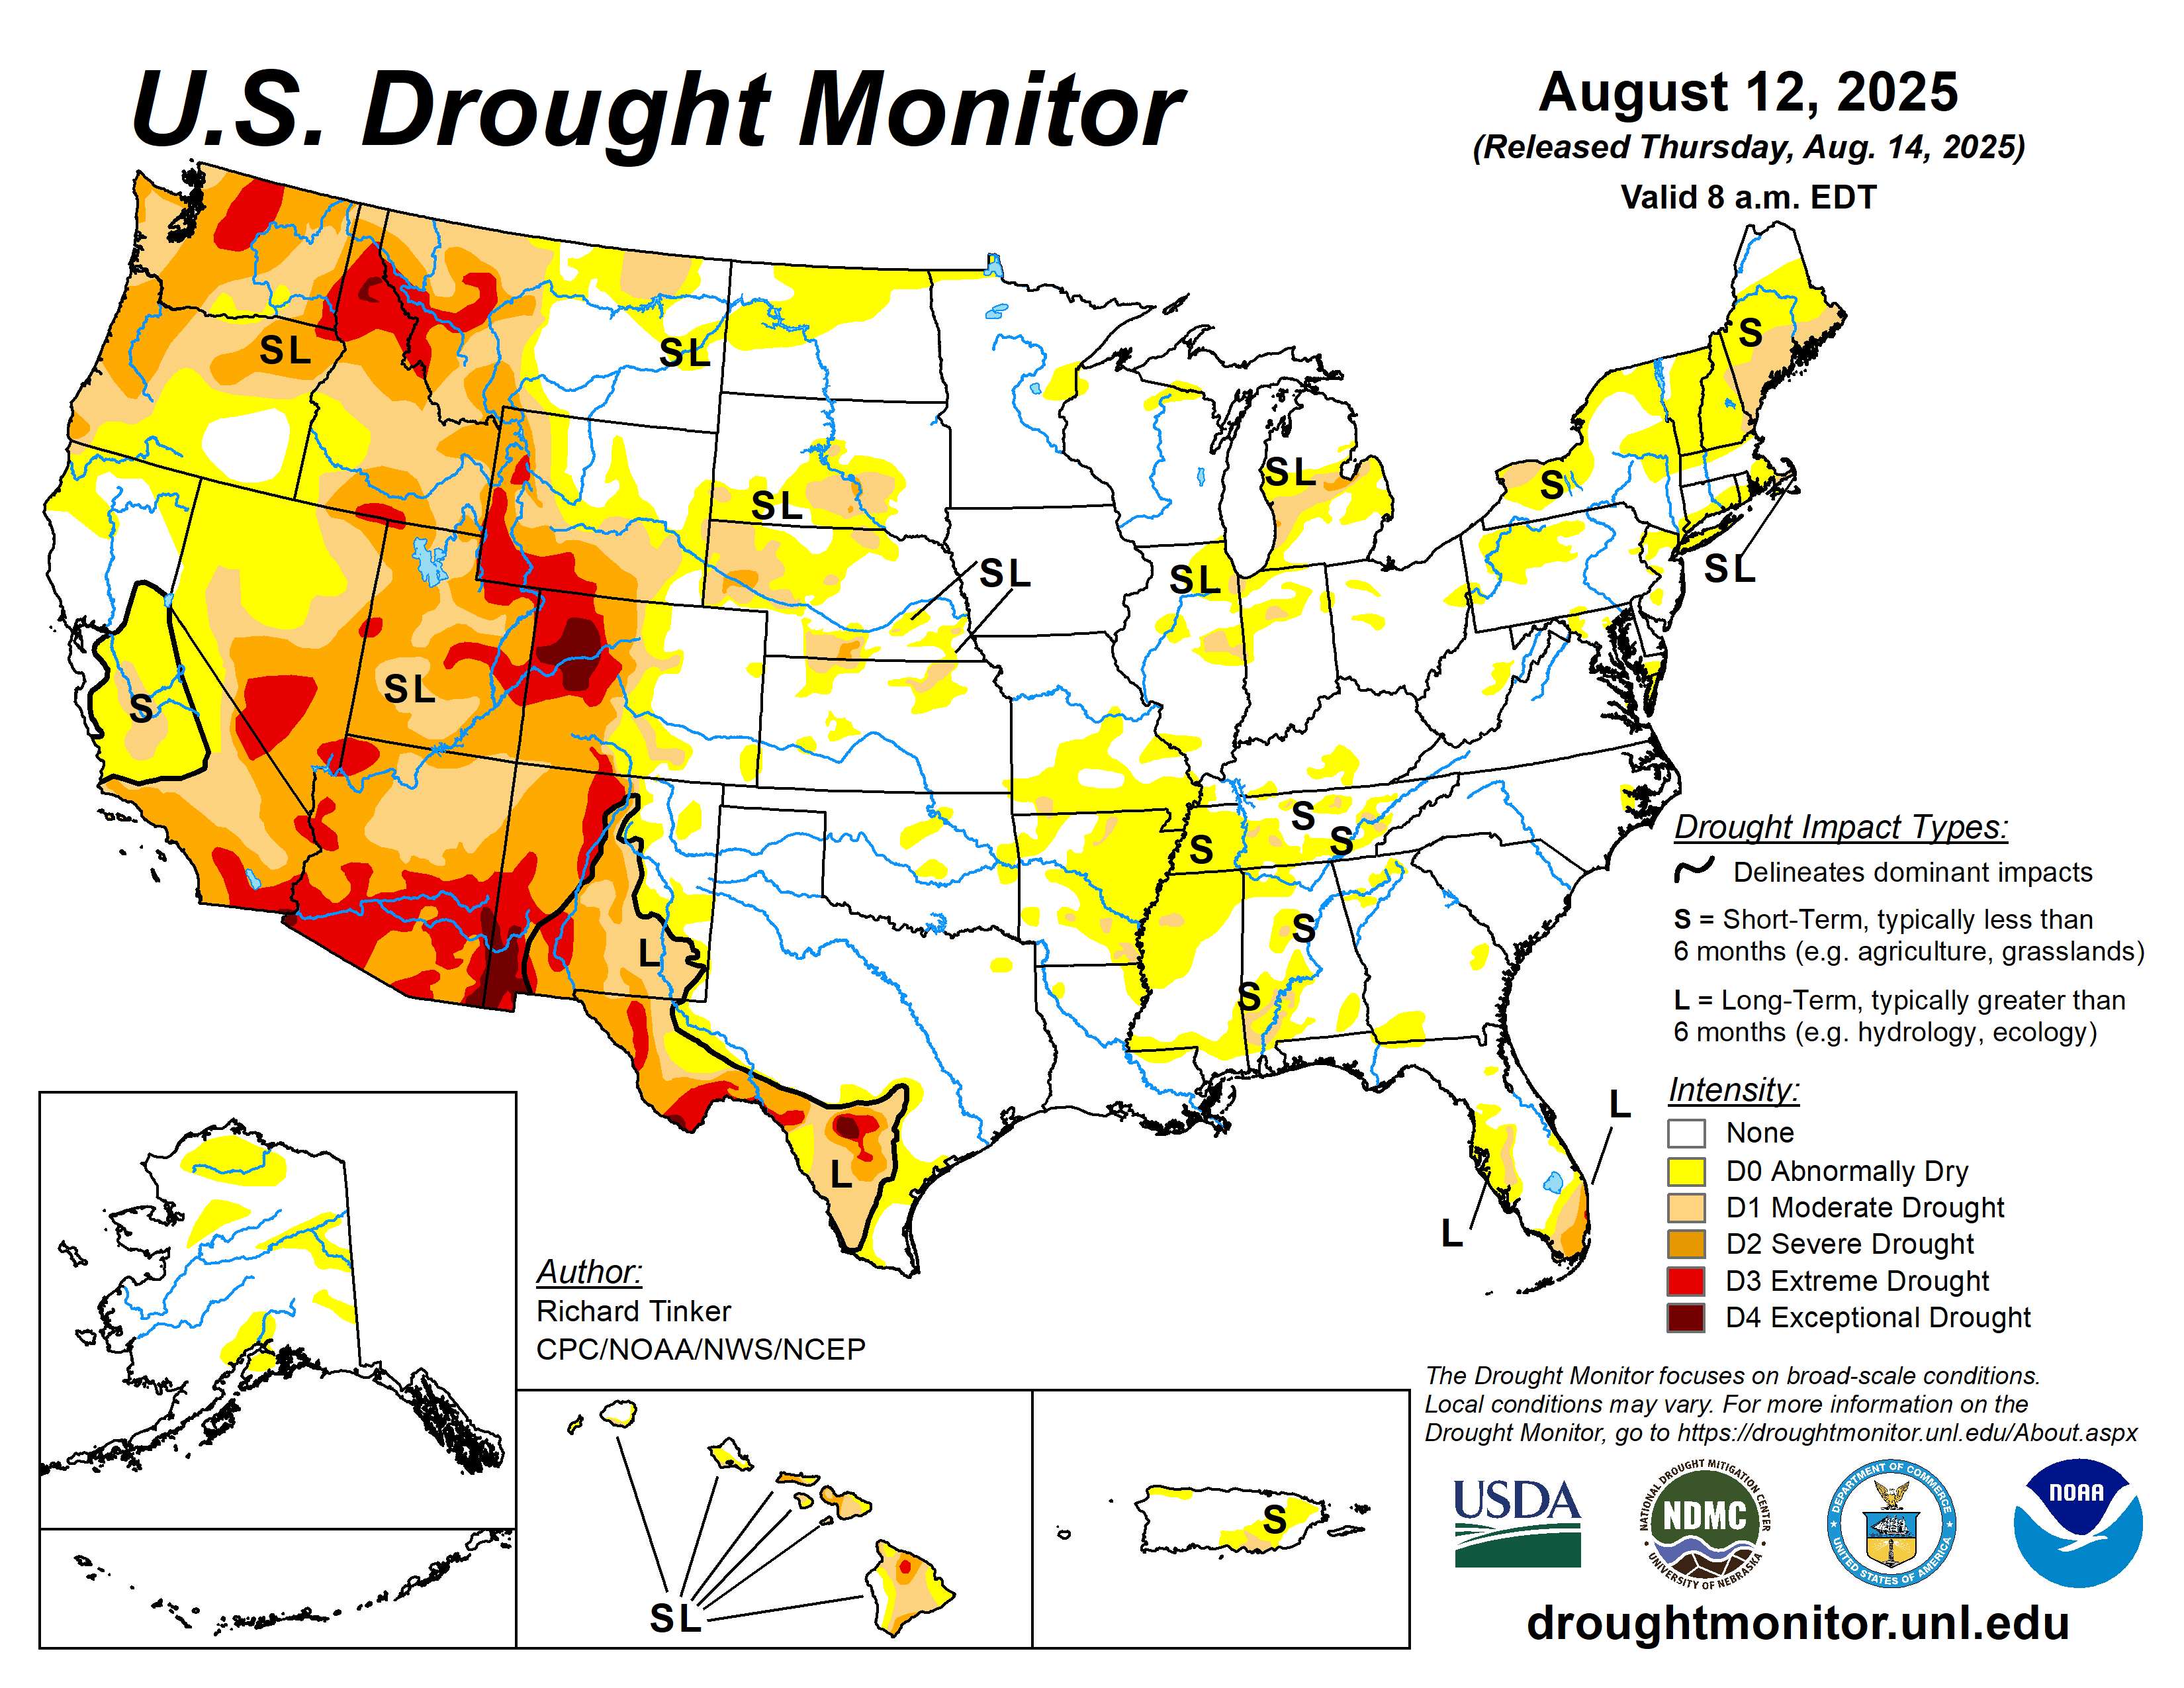
January 6, 2023 Soil Moisture, Drought, and Condition Monitoring Report. Near Normal conditions at Cheviot OH 3W. Drought conditions remain over much of the western and central US, including northwest Ohio and much of Indiana, except the Appalachian Mountain region, mid-Atlantic and northeast. Overall drought coverage and severity has decreased significantly.
Soil Moisture, Drought, and Condition Monitoring Report
Near Normal conditions at Cheviot OH 3W. Drought conditions remain over much of the western and central US, including northwest Ohio and much of Indiana, except the Appalachian Mountain region, mid-Atlantic and northeast. Overall drought coverage and severity has decreased significantly.
.
This report is specifically for the Arbor Doctor’s location 3.4 miles west of Cheviot, OH, in the western suburbs of Cincinnati in southwest Ohio. This location is also an official cooperative observation site for the National Weather Service listed as Cheviot 3W.
What is the Condition Monitoring Report? See these links for more information:
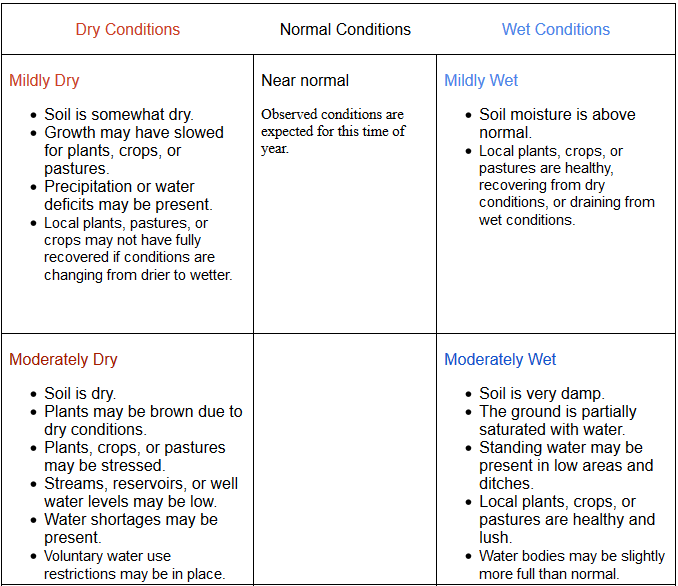
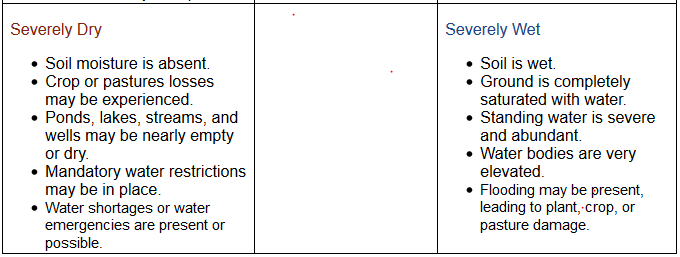
Explanation of scale bar>>>

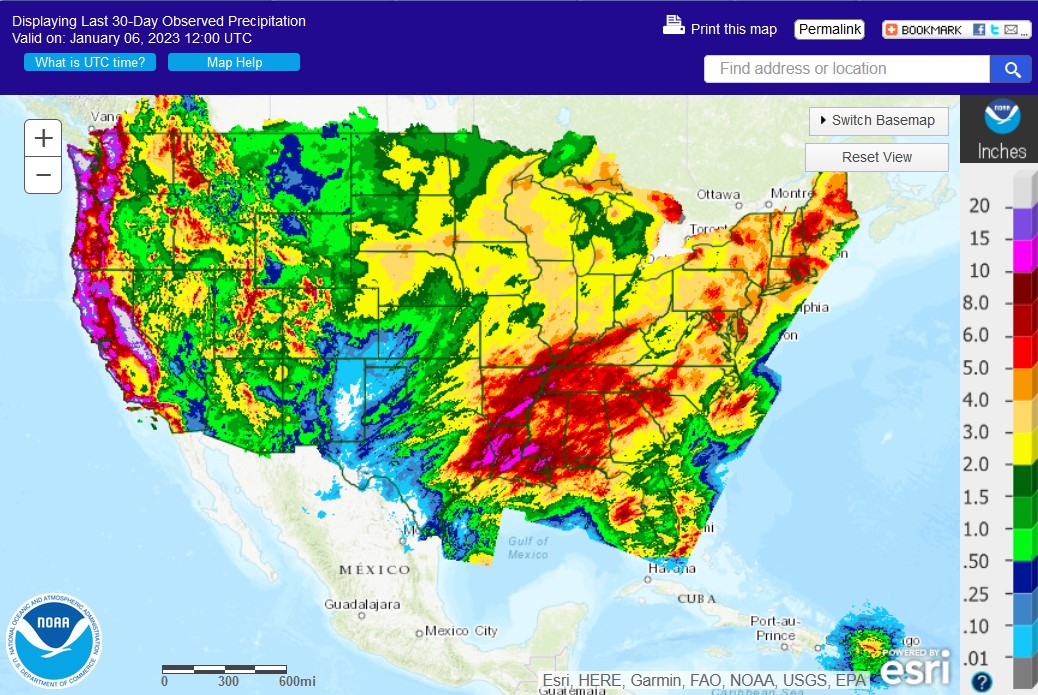
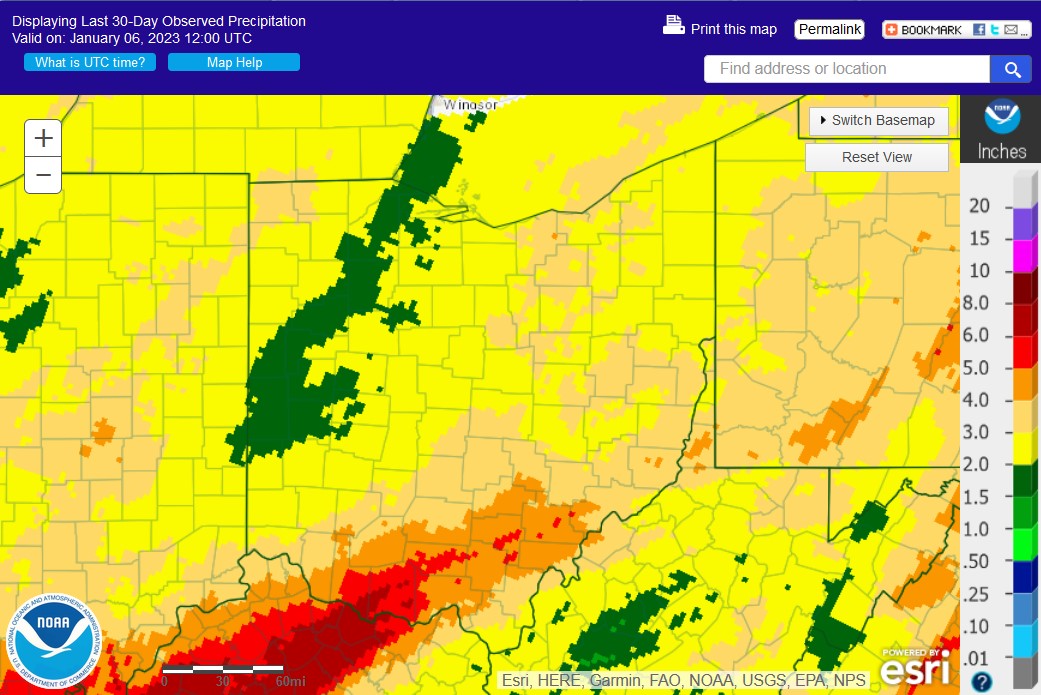
30 Day Precipitation:
.
Ohio 30-Day Precipitation
.
Search condition monitoring reports for the entire US>>> 
Click on the title or the graphic (above) to access the
U.S. Weekly Drought MonitorPDF Version of Graphic 
Click on the title or the graphic (above) to access the
U.S. Monthly Drought OutlookPDF Version of Graphic 
Click on the title or the graphic (above) to access the
U.S. Seasonal Drought OutlookPDF Version of Graphic
Other Drought links:
Please remember to water…correctly!
Water once per week, one inch per week, under the entire branch spread, in the absence of rain, May through November. Either rainfall or your watering should equal the one inch per week. Do not water if the soil is already moist. Put out a sprinkler and a straight sided soup can or rain gauge and measure one inch per week. Measure the rainfall which falls in your yard. Your trees don’t care what fell at the airport!
If burlap was left on new trees, it will repel water and the tree or shrub may die. Be sure burlap and twine are removed from the top of all root balls. If your landscaper disagrees, refer him or her to the American National Standards Institute (ANSI) industry standard for installation of landscape plants.
To the extent possible recycle fallen leaves back into the soil around the trees and maintain mulch around the trees to a radius of at least 3-5 feet. Keep mulch off trunks. Use a coarse textured mulch. Avoid triple shredded mulch. Aged arborist wood chips, mulched and composted leaves, pine bark, and pine straw are all good. Very finely ground mulches such as triple ground hardwood mulch are not beneficial and may inhibit moisture and oxygen exchange.
Drought: How Dry Seasons Affect Woody Plants >>>
>>>
1-inch capacity rain gauge >>>
Taylor rain gauge >>>
Watering: How and when>>>
Watering Trees and Shrubs>>>
2023 Weather Summary Cheviot OH 3.4W
.January 2023 Weather and Climate Summary. Very warm but very snowy>>>
May 2023 Climate Summary. Pleasant temperatures but very dry>>>
June 2023 Climate Summary. Cool and dry>>>
July Weather and Climate Summary. Dry, humid, normal temperatures ie hot>>>
August 2023 Weather Summary. Temperature and rainfall slightly below normal>>>
September 2023. Very warm and very dry.>>>
October 2023. Warm temperatures, slightly below normal rainfall>>>
November 2023 Weather Summary. Mild and very dry>>>
| Month | MonthTotal Rain and melted ppt | Annual Total Rain and melted ppt | 30 Yr Avg/ YTD Rain & melted ppt* | DepartureRain and melted ppt | Month Total Snow | Total Snow July-June | 30 Yr Avg Snow/Avg Snow Season to date July-June* | Snow SeasonDepartureJuly-June |
| Jan | 4.01 | 4.01 | 3.35/3.35 | +0.66 | 9.2 | 18.4 | 5.1/8.6 | +9.8 |
| Feb | 2.77 | 6.78 | 2.99/6.34 | +0.44 | T | 18.4 | 4.9/13.5 | +4.9 |
| Mar | 7.62 | 14.40 | 4.19/10.53 | +3.87 | 0.9 | 19.3 | 2.5/16.0 | +3.3 |
| April | 4.29 | 18.69 | 4.21/14.74 | +3.95 | T | 19.3 | 0.3/16.3 | +3.0 |
| May | 1.97 | 20.66 | 5.43/20.17 | +0.49 | 0 | 19.3 | 0.0/16.3 | +3.0 |
| June | 2.36 | 23.02 | 4.33/24.50 | -1.48 | 0 | 19.3 | 0.0/16.3 | +3.0 |
| July | 5.40 | 28.42 | 4.60/29.10 | -0.68 | 0 | 0 | 0.0/0.0 | 0 |
| Aug | 3.22 | 31.64 | 3.36/32.46 | -0/82 | 0 | 0 | 0.0/0.0 | 0 |
| Sept | 1.68 | 33.32 | 2.87/35.33 | -2.01 | 0 | 0 | 0.0/0.0 | 0 |
| Oct | 3.34 | 36.66 | 3.47/38.80 | -2.14 | T | T | 0.2/0.2 | -0.2 |
| Nov | 1.11 | 37.77 | 3.69/42.49 | -4.72 | T | T | 0.3/0.5 | -0.7 |
| Dec | 1.74 | 39.51 | 3.68/46.17 | -6.66 | 0.4 | 0.4 | 3.0/3.5 | -3.1 |
| Month | MeanTemp | MeanMaxTemp | MeanMinTemp | 30YearAvgMeanTemp | Departure | Accum Hours Below Freezing July-June | Grow Degree Days |
| Jan | 39.4 | 45.5 | 32.9 | 30.8 | +8.6 | 646 | 23 |
| Feb | 42.9 | 54.4 | 31.4 | 34.5 | +8.4 | 877 | 147 |
| Mar | 44.4 | 54.0 | 34.8 | 43.6 | +0.8 | 1000 | 338 |
| April | 55.2 | 67.5 | 42.8 | 54.2 | +1.0 | 1008 | 619 |
| May | 63.0 | 74.5 | 51.5 | 63.5 | -0.5 | 1008 | 880 |
| June | 70.5 | 81.3 | 59.6 | 72.1 | -1.6 | 1008 | 1504 |
| July | 76.0 | 86.0 | 66.0 | 75.9 | +0.1 | 0 | 2323 |
| Aug | 74.2 | 84.4 | 64.0 | 74.8 | -0.6 | 0 | NA |
| Sept | 69.5 | 81.4 | 57.7 | 67.6 | +1.9 | 0 | NA |
| Oct | 57.7 | 67.4 | 48.1 | 55.9 | +1.8 | 9 | NA |
| Nov | 46.0 | 57.4 | 34.6 | 45.1 | +0.9 | 140 | NA |
| Dec | 42.1 | 49.9 | 34.4 | 34.1 | +7.7 | 281 | NA |
Total days in 2020 of 90 degrees Fahrenheit or higher: 17
First 90 degree day: June 2
Latest 90 degree day: September 5, 2023
