
From NWS Wilmington OH @NWSILN :
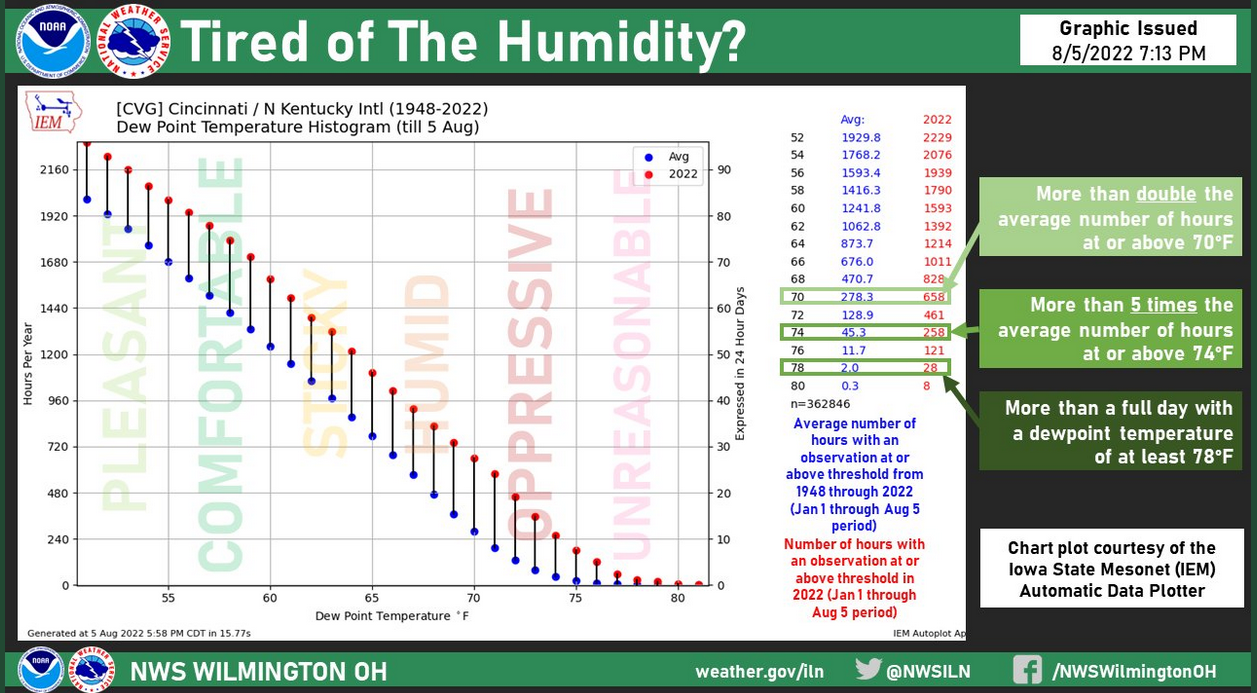
*Data Alert* – We thought we would crunch some data to see if this summer really has been more humid than avg. And… well… yes. By quite a lot, actually. Chart shows avg number of hourly obs at/above thresholds 1948-2022 vs. 2022.
Incidentally, dewpoint is an infinitely better way to measure how humid and uncomfortable it is, much better than relative humidity. A local radio station has been reciting the humidity each day rather than the dewpoint, a figure which is virtually meaningless in the absence of some rather complicated computations.
Dewpoint, the temperature at which atmospheric moisture will condense, is easy:
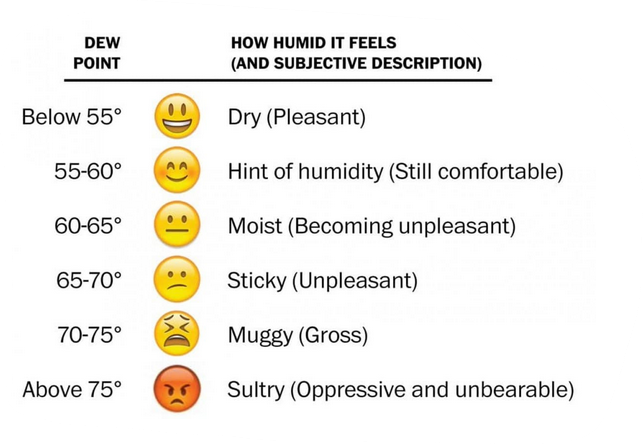
This comfort chart works at just about any temperature.